Pearl Farming Micro-Nanoplastics Affect Oyster Physiology and Pearl Quality
Abstract
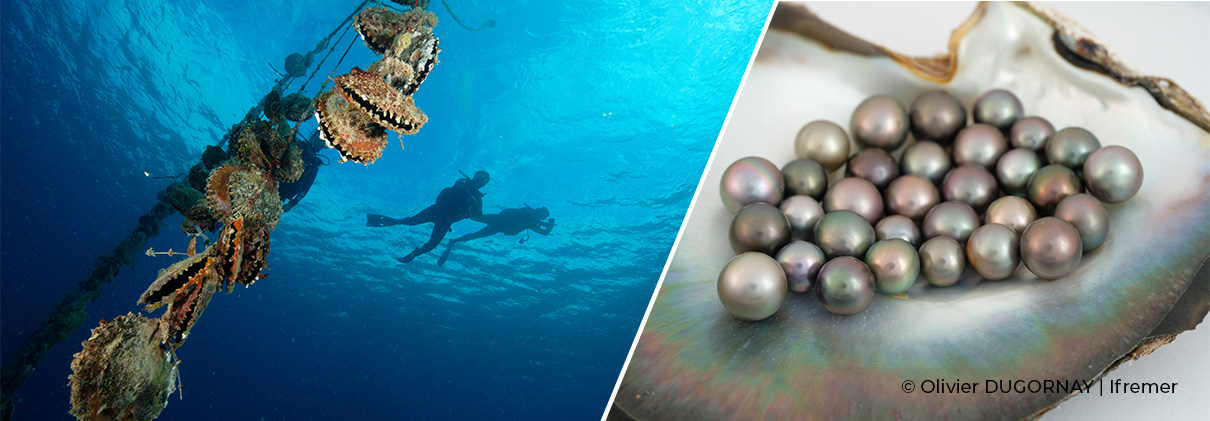
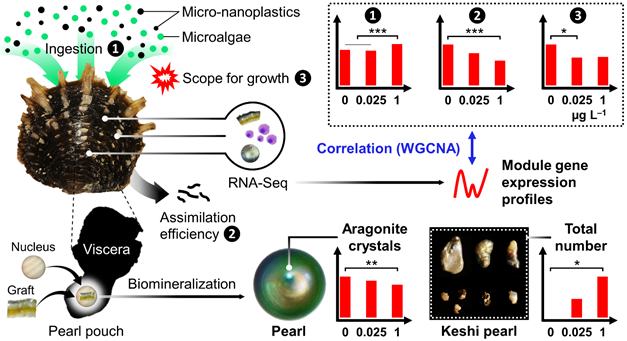
Pearl farming is crucial for the economy of French Polynesia. However, rearing structures contribute significantly to plastic waste, and the widespread contamination of pearl farming lagoons by microplastics has raised concerns about risks to the pearl industry. This study aimed to evaluate the effects of micro-nanoplastics (MNPs, 0.4–200 μm) on the pearl oyster (Pinctada margaritifera) over a 5-month pearl production cycle by closely mimicking ecological scenarios. MNPs were produced from weathered plastic pearl farming gear and tested at environmentally relevant concentrations (0.025 and 1 μg L–1) to decipher biological and functional responses through integrative approaches. The significant findings highlighted the impacts of MNPs on oyster physiology and pearl quality, even at remarkably low concentrations. Exposure to MNPs induced changes in energy metabolism, predominantly driven by reduced assimilation efficiency of microalgae, leading to an alteration in gene expression patterns. A distinct gene expression module exhibited a strong correlation with physiological parameters affected by MNP conditions, identifying key genes as potential environmental indicators of nutritional-MNP stress in cultured oysters. The alteration in pearl biomineralization, evidenced by thinner aragonite crystals and the presence of abnormal biomineral concretions, known as keshi pearls, raises concerns about the potential long-term impact on the Polynesian pearl industry.
Graphical abstract
Keywords
Pearl ; oyster ; micro-nanoplastic exposure ; environmental scenarios ; ecophysiology ; energy metabolism ; functional genomics ; pearl cycle
Reference
Gardon, Tony, Jeremy Le Luyer, Gilles Le Moullac, Claude Soyez, Fabienne Lagarde, Alexandre Dehaut, Ika Paul-Pont, et Arnaud Huvet. « Pearl Farming Micro-Nanoplastics Affect Oyster Physiology and Pearl Quality ». ENVIRONMENTAL SCIENCE & TECHNOLOGY 58, no 1 (9 janvier 2024): 207‑18. https://doi.org/10.1021/acs.est.3c06684.