Tag Archive for: tuna

The Warmalis 3 oceanographic campaign!

,

Oceanographic Campaign Warmalis 3: Understanding the Functioning of the Pelagic Oceanic Ecosystem and Ultimately Determining its Influence on Tuna Resources in the Western and Central Pacific Region

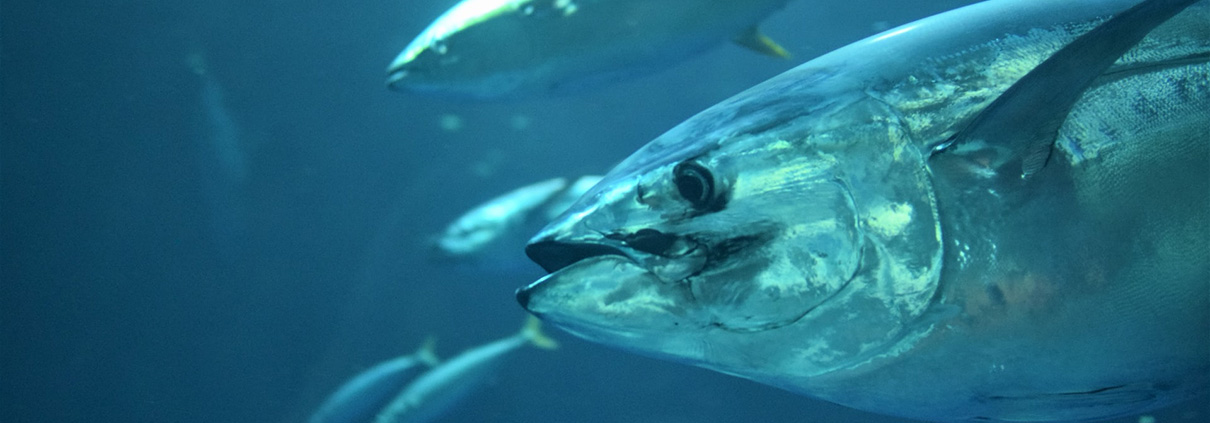
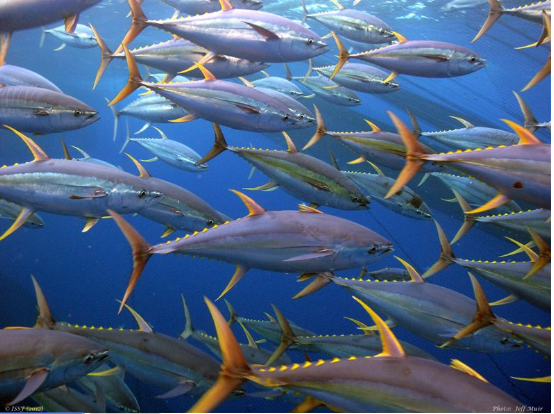
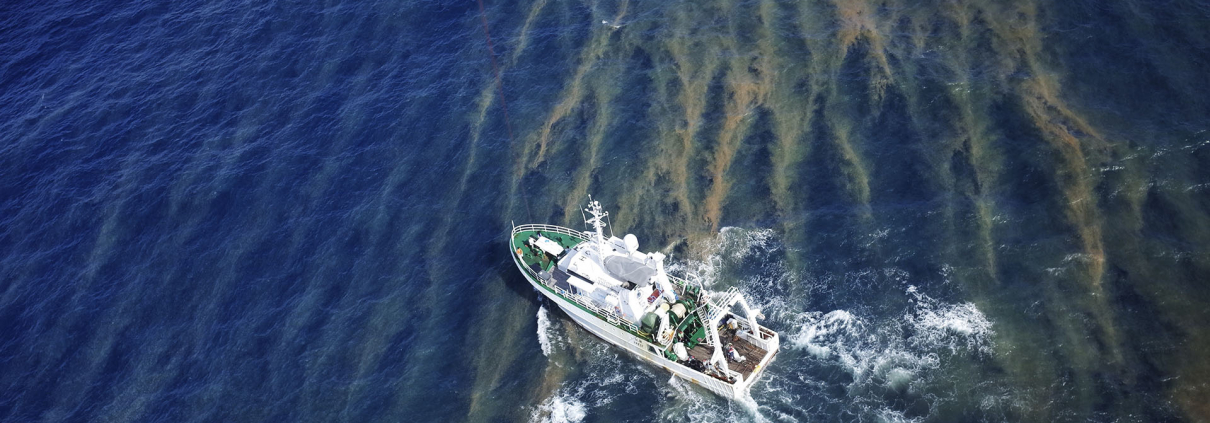
The WARMALIS 3 campaign, taking place from September 25 to November 8 aboard the R/V ANTEA, aims to better understand the functioning of the pelagic oceanic ecosystem and determine its influence on tuna resources in the western and central Pacific region, which account for more than 50% of global catches. In particular, the campaign studies intermediate trophic levels (zooplankton and micronecton), which constitute the primary food for all large pelagic species in the Pacific. To achieve this, biological data (micronecton trawls, zooplankton nets, EK80 sonars, and acoustic profilers), as well as physical and chemical data, are collected.


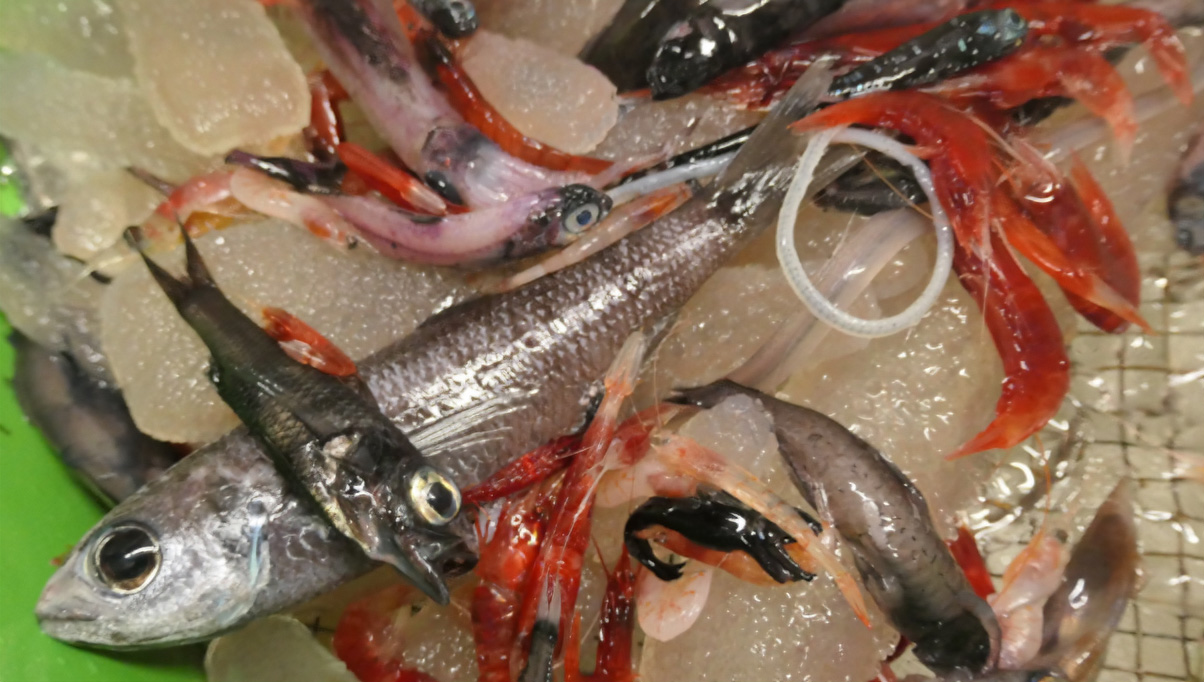
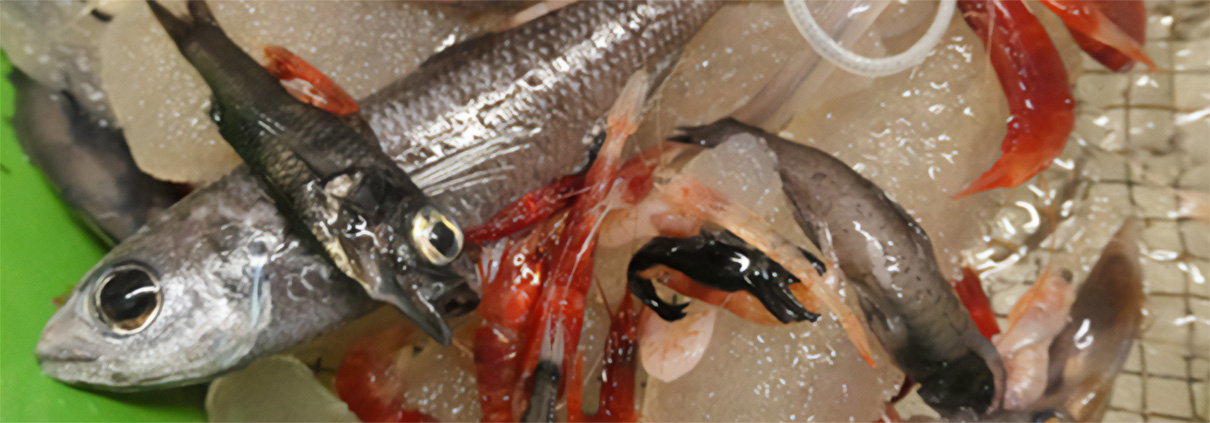
Example of micronecton capture, with gelatinous organisms, small fish, and shrimp commonly consumed by tuna and other top predators (Photo: V. Allain, SPC-IRD).


WARMALIS 3 is the last in a series of three campaigns (2021, 2022, 2023) part of the MICROPAC project (Micronecton in the Pacific, 2021-2023) led by Christophe Menkès (IRD/UMR ENTROPIE) and Valérie Allain (CPS) with partner units: MIO, IMAGO, LEMAR, LOPS, LEGOS, and CLS. After exploring the western and central Pacific from south to north in previous years, the crew is undertaking a 45-day east-to-west traverse along the equator this year.
Four colleagues from LEMAR are on board: Laure Barbin, Jérémie Habasque, Anne Lebourges, and Anaïs Médieu.


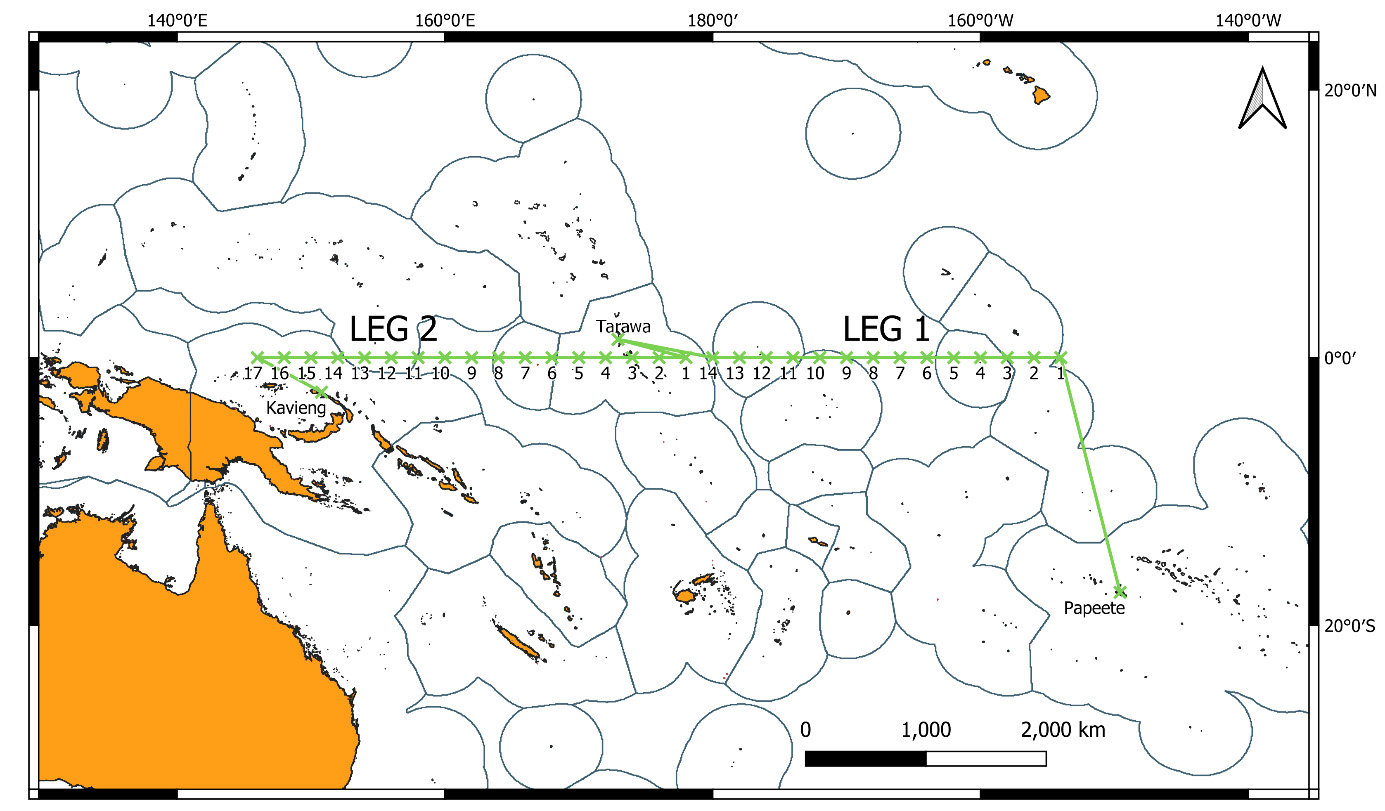
Campaign plan for Warmalis 3.


You can follow the ship’s log on the mission blog.

Evidence that Pacific tuna mercury levels are driven by marine methylmercury production and anthropogenic inputs

Abstract

Pacific Ocean tuna is among the most-consumed seafood products but contains relatively high levels of the neurotoxin methylmercury. Limited observations suggest tuna mercury levels vary in space and time, yet the drivers are not well understood. Here, we map mercury concentrations in skipjack tuna across the Pacific Ocean and build generalized additive models to quantify the anthropogenic, ecological, and biogeochemical drivers. Skipjack mercury levels display a fivefold spatial gradient, with maximum concentrations in the northwest near Asia, intermediate values in the east, and the lowest levels in the west, southwest, and central Pacific. Large spatial differences can be explained by the depth of the seawater methylmercury peak near low-oxygen zones, leading to enhanced tuna mercury concentrations in regions where oxygen depletion is shallow. Despite this natural biogeochemical control, the mercury hotspot in tuna caught near Asia is explained by elevated atmospheric mercury concentrations and/or mercury river inputs to the coastal shelf. While we cannot ignore the legacy mercury contribution from other regions to the Pacific Ocean (e.g., North America and Europe), our results suggest that recent anthropogenic mercury release, which is currently largest in Asia, contributes directly to present-day human mercury exposure.


Graphical abstract


Spatial variability of skipjack mercury concentrations. Smoothed spatial contour maps of (A) observed and (B) standardized Hg concentrations (micrograms ⋅ grams−1, dw) in skipjack white muscle samples from the Pacific Ocean. The black dots represent the location of skipjack samples. Ocean areas correspond to the sample origin: NWPO, CNPO, NEPO, EPO, SWPO, and WCPO. The transparent dots represent the location of seawater samples with available and published MeHg data


Highlights

Humans are exposed to toxic methylmercury mainly by consuming marine fish. New environmental policies under the Minamata Convention rely on a yet-poorly-known understanding of how mercury emissions translate into fish methylmercury levels. Here, we provide the first detailed map of mercury concentrations from skipjack tuna across the Pacific. Our study shows that the natural functioning of the global ocean has an important influence on tuna mercury concentrations, specifically in relation to the depth at which methylmercury concentrations peak in the water column. However, mercury inputs originating from anthropogenic sources are also detectable, leading to enhanced tuna mercury levels in the northwestern Pacific Ocean that cannot be explained solely by oceanic processes.


Reference

Anaïs Médieu, David Point, Takaaki Itai, Hélène Angot, Pearse J. Buchanan, Valérie Allain, Leanne Fuller, Shane Griffiths, David P. Gillikin, Jeroen E. Sonke, Lars-Eric Heimbürger-Boavida, Marie-Maëlle Desgranges, Christophe E. Menkes, Daniel J. Madigan, Pablo Brosset, Olivier Gauthier, Alessandro Tagliabue, Laurent Bopp, Anouk Verheyden, Anne Lorrain. Evidence that Pacific tuna mercury levels are driven by marine methylmercury production and anthropogenic inputs. Proceedings of the National Academy of Sciences Jan 2022, 119 (2) e2113032119; DOI: 10.1073/pnas.2113032119

Read the article on PNAS website

A Model of Mercury Distribution in Tuna from the Western and Central Pacific Ocean: Influence of Physiology, Ecology and Environmental Factors

Patrick Houssard, David Point, Laura Tremblay-Boyer, Valérie Allain, Heidi Pethybridge, Jeremy Masbou, Bridget E. Ferriss, Pascale A. Baya, Christelle Lagane, Christophe E. Menkes, Yves Letourneur, et Anne Lorrain

ABSTRACT :

https://pubs.acs.org/appl/literatum/publisher/achs/journals/content/esthag/2019/esthag.2019.53.issue-3/acs.est.8b06058/20190129/images/medium/es-2018-06058g_0006.gif

  • Information on ocean scale drivers of methylmercury levels and variability in tuna is scarce, yet crucial in the context of anthropogenic mercury (Hg) inputs and potential threats to human health. Here we assess Hg concentrations in three commercial tuna species (bigeye, yellowfin, and albacore, n = 1000) from the Western and Central Pacific Ocean (WCPO).
  • Models were developed to map regional Hg variance and understand the main drivers. Mercury concentrations are enriched in southern latitudes (10°S−20°S) relative to the equator (0°−10°S) for each species, with bigeye exhibiting the strongest spatial gradients. Fish size is the primary factor explaining Hg variance but physical oceanography also contributes, with higher Hg concentrations in regions exhibiting deeper thermoclines.
  • Tuna trophic position and oceanic primary productivity were of weaker importance. Predictive models perform well in the Central Equatorial Pacific and Hawaii, but underestimate Hg concentrations in the Eastern Pacific. A literature review from the global ocean indicates that size tends to govern tuna Hg concentrations, however regional information on vertical habitats, methylmercury production, and/or Hg inputs are needed to understand Hg distribution at a broader scale. Finally, this study establishes a geographical context of Hg levels to weigh the risks and benefits of tuna consumption in the WCPO.

Observed spatial variation in mercury concentrations (mg*kg −1 , dry weight) for bigeye, yellowfin, and albacore muscle samples captured in the Western and Central Pacific Ocean. Gray lines outline the five biogeochemical regions as defined in Houssard et al., 2017: NPTG (North Pacific Tropical Gyre), WARMm (Warm Pool modified), PEQD (Pacific Equatorial Divergence), SPSGm (South Pacific Subtropical Gyre modified) and ARCHm (Archipelagic deep basins modified) along with AUS-TAZ (Australia-Tasmania) and NZ (New Zealand).

CITATION :

Houssard, P., Point, D., Tremblay-Boyer, L., Allain, V., Pethybridge, H., Masbou, J., Ferriss, B.E., Baya, P.A., Lagane, C., Menkes, C.E., Letourneur, Y., and Lorrain, A. 2019. A Model of Mercury Distribution in Tuna from the Western and Central Pacific Ocean: Influence of Physiology, Ecology and Environmental Factors. Environmental Science & Technology. doi:10.1021/acs.est.8b06058.

Click here for the IRD news about this study (in French).

Tag Archive for: tuna

Tag Archive for: tuna

BIOPELAGOS

,
Nectalis 5

MERTOX

,