Revisiting tolerance to ocean acidification: Insights from a new framework combining physiological and molecular tipping points of Pacific oyster
Abstract
Studies on the impact of ocean acidification on marine organisms involve exposing organisms to future acidification scenarios, which has limited relevance for coastal calcifiers living in a mosaic of habitats. Identification of tipping points beyond which detrimental effects are observed is a widely generalizable proxy of acidification susceptibility at the population level. This approach is limited to a handful of studies that focus on only a few macro-physiological traits, thus overlooking the whole organism response. Here we develop a framework to analyze the broad macro-physiological and molecular responses over a wide pH range in juvenile oyster. We identify low tipping points for physiological traits at pH 7.3–6.9 that coincide with a major reshuffling in membrane lipids and transcriptome. In contrast, a drop in pH affects shell parameters above tipping points, likely impacting animal fitness. These findings were made possible by the development of an innovative methodology to synthesize and identify the main patterns of variations in large -omic data sets, fitting them to pH and identifying molecular tipping points. We propose the broad application of our framework to the assessment of effects of global change on other organisms.
Graphical abstract
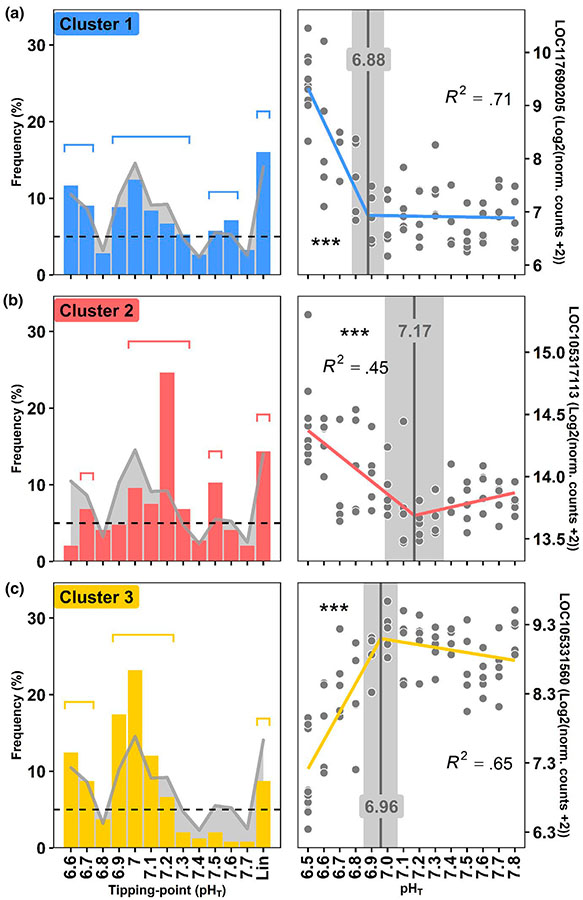
Tipping points of oyster transcriptome. (a–c) Frequency distribution of tipping point for piecewise linear relationships (left side). Linear and log-linear models (no tipping point) are under “Lin” name. Genes are grouped into three clusters of genes that co-vary together. The gray line indicates the distribution frequency of all genes irrespective of clusters. Groups of genes that exhibit neighboring tipping points with distribution frequencies >5% (shown as a dotted line), were grouped together. The segments above the bars indicate the groups of genes on which GO analyses were conducted. In each case, the gene that best represents the cluster according to module membership, gene significance for pH and R2 is presented as a function of pH as an example (right side). Tipping points and their 95% confidence intervals are shown in gray. The significance levels of the slopes are presented using stars (p < .001***, p < .01**, p < .05*). Gene names are as follows: LOC117690205: monocarboxylate transporter 12-like, LOC105317113: 60S ribosomal protein L10a, LOC105331560: protocadherin Fat 4

